

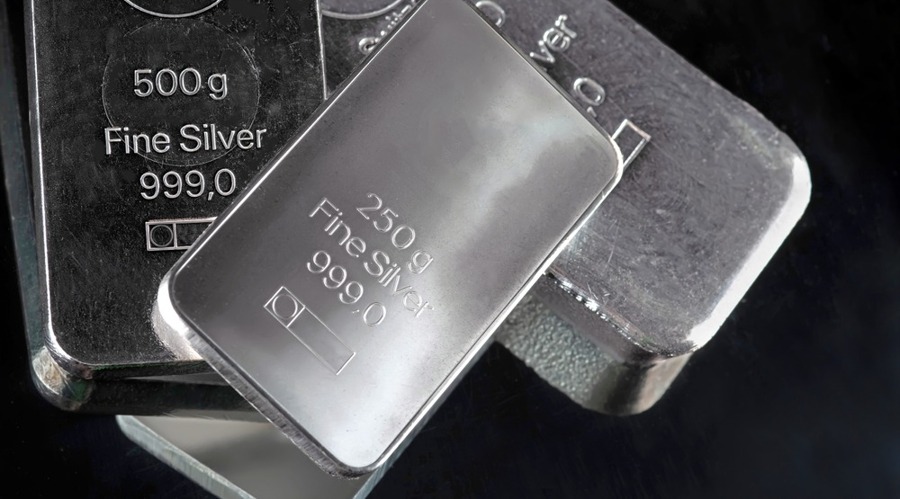
Silver traded at $63.63 per ounce at 09:51 UTC on Wednesday, September 2, down 0.67% on the session after falling about 3.5% on Tuesday. XAG/USD was testing its lowest level in more than two weeks after a late-August rally failed near $72.
The pullback has returned silver below its 50-day and 200-day exponential moving averages. My daily chart puts $61.15 at the immediate support test, with a confirmed break opening $55.42 and then $45.40, almost 29% below the chart price.
This is a fresh setup, not an untouched continuation of my July silver forecast. That analysis said a weekly close above $65 would cancel the bear case.
Silver subsequently reclaimed the threshold and rallied toward $72. That invalidated the earlier setup before the latest reversal created a new trigger.
Why Silver Price Is Falling Below the 200-Day EMA
The rebound reached its high point on August 28, when silver briefly approached $72 and then reversed by more than 4%. The round $70 area was already a major chart barrier. It combines February lows with the former floor that supported elevated prices from the start of 2026 until June.
Silver has now moved back below the 50-day EMA at $64.65 and the 200-day EMA at $65.39. The faster average remains below the slower one, and price has slipped beneath both. That restores a bearish daily structure, but the September 2 candle was still open when the chart was captured.
Silver falls below its 50 and 200 EMAs as $61.15 support comes into focus. Source: TradingView
A daily close below both averages would provide stronger confirmation than the intraday breach alone. The next decision point is $61.15, a horizontal level drawn from the March lows and now only about 3.9% below the reference price.
| Scenario | Confirmation | Next Levels | Invalidation |
|---|---|---|---|
| Bearish continuation | Daily close below $61.15 | $55.42, then $45.40 | Recovery above $65.39 |
| Support rebound | $61.15 holds and price reclaims both EMAs | $70.05 resistance | Daily close below $61.15 |
| Bearish thesis fails | Daily close above $70.05 | August high near $72 | Return below the EMA cluster |
Silver Price Predictions on X Span $50 to $300
The technical deterioration is arriving as silver forecasts on X move toward opposite extremes. These posts are individual views shared on social media, not a consensus forecast, but they show how widely expectations have split after silver’s volatile year.
Bullish Silver Forecasts Target $100, $200 and $300
Apu tied a three-digit target to tight physical supply. The account wrote on September 1 that “$100 per ounce is a very reasonable target,” arguing that physical demand could overwhelm available supply. That target is about 57% above $63.63.
What about Silver?
A silver squeeze caused by a huge demand for physical stock will overwhelm the available supply and will make its price sky rocket, a lot of big institutions have shorted paper contracts worth billions…
$100 per ounce is a very reasonable target that we…
— Apu (@apu_ACM) September 1, 2026
Yessah Blessah published the most aggressive near-term number in the group on September 2: “Silver to $300 (30:1 on a spike).” The author linked the call to a weaker dollar and added, “Just my opinion.” A move to $300 would require a gain of about 371% from the chart price.
For sure though: All those assets are going higher my friend 100%.
Oil to $300
Gold to $10k
Silver to $300 (30:1 on a spike)Just my opinion
Dollar down = ALL assets go up
— Yessah Blessah (@YessahBlessahCC) September 2, 2026
In an August 19 video excerpt posted by Jesse Day, David Hunter said, “I’m calling for silver to go to $200 this cycle.” He then projected a later fall toward $50.
The $200 first leg would be about 214% above current price, while the later $50 level sits about 21% below it.
“I’m calling for silver to go to $200 this cycle, fall back … so let’s say it falls back to $50, you could go from $50 to $1,000 in the next cycle.” @DaveHcontrarian on where he sees #silver both before and after the global bust he’s forecasting. Full interview up TOMORROW. pic.twitter.com/BMf9PmseFu
— Jesse Day (@jessebday) August 19, 2026
Bearish Silver Forecasts Focus on $63.50 and $50
Fthegurus rejected the three-digit calls in an August 21 post. The account’s central claim was direct: “Silver will not trade at $100/oz again in 2026.” That view does not itself set a downside target, but it places a hard ceiling on the social-media forecasts above.
🚨 Caution on Silver
Silver just posted a strong month — up roughly 16–18%.
That kind of move almost guarantees the usual cycle: Silver gurus and X “experts” will start flooding timelines with moonshot targets. Expect $200… then $300/oz calls any day now.
My view hasn’t…
— Fthegurus (@fthegurus) August 21, 2026
The Charles Nenner Research Center focused on a target already reached instead of a new projection. Its September 2 update said, “Silver (September) reached our downside price target of 63.50.” That level almost matches the $63.63 price shown on my chart.
#Silver (September) reached our downside price target of 63.50.
For new targets, cycle direction and important levels, get a 30-day FREE TRIAL here:https://t.co/vRAEyZWxlV#PreciousMetals #xauusd #marketcyclesforecast
— Charles Nenner Research Center (@NennerResearch) September 2, 2026
Why Overnight Costs Matter for Long Silver Trades
Price targets several months away have a financing dimension for leveraged CFD traders. A position kept open through daily rollover may generate an overnight charge or credit, depending on the instrument, trade direction and account terms.
Born2Trade said this week that it introduced positive long swaps on gold and silver for eligible Dynamic account holders. Long XAU/USD and XAG/USD positions can receive up to $19.99 per lot per night through December 31, 2026, according to the company.
The promotion applies to new and existing accounts but requires one-directional exposure on eligible positions. Born2Trade said internal hedging across its Dynamic, Standard and ECN accounts is not permitted under the offer.
Born2Trade presents the positive rate as a point of differentiation in retail metals trading. It does not extend market hours, remove leveraged-trading risk or make a $100 or $300 silver forecast more likely.
The offer changes the cost of carrying an eligible long CFD overnight. That matters more when a trade thesis lasts for months instead of a single session.
Physical Supply Is the Strongest Bullish Counterpoint
The physical-market argument behind the $100 squeeze call has a factual base, although it does not validate any specific price target. The Silver Institute forecast a sixth consecutive annual market deficit for 2026, estimating a 67 million-ounce shortfall.
It also projected physical investment demand to rise 20% to 227 million ounces. The Silver Institute expected total supply to increase 1.5% to 1.05 billion ounces.
Industrial fabrication, however, was forecast to decline 2% to about 650 million ounces as photovoltaic manufacturers use less silver or substitute other materials.
That mix explains why squeeze narratives survive even while the chart weakens. Persistent deficits and tight physical liquidity can support a longer-term bull case.
Higher prices also encourage recycling, substitution and weaker jewelry demand. None of those annual estimates determines where the next daily close occurs.
What Would Invalidate the Bearish Silver Outlook
My near-term base case remains lower while silver trades beneath the EMA cluster at $64.65-$65.39. A daily close below $61.15 would activate $55.42, roughly 13% below the chart reference price. Losing that shelf would expose the October 2025 area near $45.40, for a decline of about 29%.
The first warning for bears would be a daily close back above the 200-day EMA at $65.39. A recovery through $70.05 would negate the latest breakdown and force another test of the August high near $72.
Until either confirmation occurs, $61.15 and $65.39 define the short-term range that decides whether silver’s next major move is toward $55 or back toward $70.
Silver traded at $63.63 per ounce at 09:51 UTC on Wednesday, September 2, down 0.67% on the session after falling about 3.5% on Tuesday. XAG/USD was testing its lowest level in more than two weeks after a late-August rally failed near $72.
The pullback has returned silver below its 50-day and 200-day exponential moving averages. My daily chart puts $61.15 at the immediate support test, with a confirmed break opening $55.42 and then $45.40, almost 29% below the chart price.
This is a fresh setup, not an untouched continuation of my July silver forecast. That analysis said a weekly close above $65 would cancel the bear case.
Silver subsequently reclaimed the threshold and rallied toward $72. That invalidated the earlier setup before the latest reversal created a new trigger.
Why Silver Price Is Falling Below the 200-Day EMA
The rebound reached its high point on August 28, when silver briefly approached $72 and then reversed by more than 4%. The round $70 area was already a major chart barrier. It combines February lows with the former floor that supported elevated prices from the start of 2026 until June.
Silver has now moved back below the 50-day EMA at $64.65 and the 200-day EMA at $65.39. The faster average remains below the slower one, and price has slipped beneath both. That restores a bearish daily structure, but the September 2 candle was still open when the chart was captured.
Silver falls below its 50 and 200 EMAs as $61.15 support comes into focus. Source: TradingView
A daily close below both averages would provide stronger confirmation than the intraday breach alone. The next decision point is $61.15, a horizontal level drawn from the March lows and now only about 3.9% below the reference price.
| Scenario | Confirmation | Next Levels | Invalidation |
|---|---|---|---|
| Bearish continuation | Daily close below $61.15 | $55.42, then $45.40 | Recovery above $65.39 |
| Support rebound | $61.15 holds and price reclaims both EMAs | $70.05 resistance | Daily close below $61.15 |
| Bearish thesis fails | Daily close above $70.05 | August high near $72 | Return below the EMA cluster |
Silver Price Predictions on X Span $50 to $300
The technical deterioration is arriving as silver forecasts on X move toward opposite extremes. These posts are individual views shared on social media, not a consensus forecast, but they show how widely expectations have split after silver’s volatile year.
Bullish Silver Forecasts Target $100, $200 and $300
Apu tied a three-digit target to tight physical supply. The account wrote on September 1 that “$100 per ounce is a very reasonable target,” arguing that physical demand could overwhelm available supply. That target is about 57% above $63.63.
What about Silver?
A silver squeeze caused by a huge demand for physical stock will overwhelm the available supply and will make its price sky rocket, a lot of big institutions have shorted paper contracts worth billions…
$100 per ounce is a very reasonable target that we…
— Apu (@apu_ACM) September 1, 2026
Yessah Blessah published the most aggressive near-term number in the group on September 2: “Silver to $300 (30:1 on a spike).” The author linked the call to a weaker dollar and added, “Just my opinion.” A move to $300 would require a gain of about 371% from the chart price.
For sure though: All those assets are going higher my friend 100%.
Oil to $300
Gold to $10k
Silver to $300 (30:1 on a spike)Just my opinion
Dollar down = ALL assets go up
— Yessah Blessah (@YessahBlessahCC) September 2, 2026
In an August 19 video excerpt posted by Jesse Day, David Hunter said, “I’m calling for silver to go to $200 this cycle.” He then projected a later fall toward $50.
The $200 first leg would be about 214% above current price, while the later $50 level sits about 21% below it.
“I’m calling for silver to go to $200 this cycle, fall back … so let’s say it falls back to $50, you could go from $50 to $1,000 in the next cycle.” @DaveHcontrarian on where he sees #silver both before and after the global bust he’s forecasting. Full interview up TOMORROW. pic.twitter.com/BMf9PmseFu
— Jesse Day (@jessebday) August 19, 2026
Bearish Silver Forecasts Focus on $63.50 and $50
Fthegurus rejected the three-digit calls in an August 21 post. The account’s central claim was direct: “Silver will not trade at $100/oz again in 2026.” That view does not itself set a downside target, but it places a hard ceiling on the social-media forecasts above.
🚨 Caution on Silver
Silver just posted a strong month — up roughly 16–18%.
That kind of move almost guarantees the usual cycle: Silver gurus and X “experts” will start flooding timelines with moonshot targets. Expect $200… then $300/oz calls any day now.
My view hasn’t…
— Fthegurus (@fthegurus) August 21, 2026
The Charles Nenner Research Center focused on a target already reached instead of a new projection. Its September 2 update said, “Silver (September) reached our downside price target of 63.50.” That level almost matches the $63.63 price shown on my chart.
#Silver (September) reached our downside price target of 63.50.
For new targets, cycle direction and important levels, get a 30-day FREE TRIAL here:https://t.co/vRAEyZWxlV#PreciousMetals #xauusd #marketcyclesforecast
— Charles Nenner Research Center (@NennerResearch) September 2, 2026
Why Overnight Costs Matter for Long Silver Trades
Price targets several months away have a financing dimension for leveraged CFD traders. A position kept open through daily rollover may generate an overnight charge or credit, depending on the instrument, trade direction and account terms.
Born2Trade said this week that it introduced positive long swaps on gold and silver for eligible Dynamic account holders. Long XAU/USD and XAG/USD positions can receive up to $19.99 per lot per night through December 31, 2026, according to the company.
The promotion applies to new and existing accounts but requires one-directional exposure on eligible positions. Born2Trade said internal hedging across its Dynamic, Standard and ECN accounts is not permitted under the offer.
Born2Trade presents the positive rate as a point of differentiation in retail metals trading. It does not extend market hours, remove leveraged-trading risk or make a $100 or $300 silver forecast more likely.
The offer changes the cost of carrying an eligible long CFD overnight. That matters more when a trade thesis lasts for months instead of a single session.
Physical Supply Is the Strongest Bullish Counterpoint
The physical-market argument behind the $100 squeeze call has a factual base, although it does not validate any specific price target. The Silver Institute forecast a sixth consecutive annual market deficit for 2026, estimating a 67 million-ounce shortfall.
It also projected physical investment demand to rise 20% to 227 million ounces. The Silver Institute expected total supply to increase 1.5% to 1.05 billion ounces.
Industrial fabrication, however, was forecast to decline 2% to about 650 million ounces as photovoltaic manufacturers use less silver or substitute other materials.
That mix explains why squeeze narratives survive even while the chart weakens. Persistent deficits and tight physical liquidity can support a longer-term bull case.
Higher prices also encourage recycling, substitution and weaker jewelry demand. None of those annual estimates determines where the next daily close occurs.
What Would Invalidate the Bearish Silver Outlook
My near-term base case remains lower while silver trades beneath the EMA cluster at $64.65-$65.39. A daily close below $61.15 would activate $55.42, roughly 13% below the chart reference price. Losing that shelf would expose the October 2025 area near $45.40, for a decline of about 29%.
The first warning for bears would be a daily close back above the 200-day EMA at $65.39. A recovery through $70.05 would negate the latest breakdown and force another test of the August high near $72.
Until either confirmation occurs, $61.15 and $65.39 define the short-term range that decides whether silver’s next major move is toward $55 or back toward $70.


