


Bitcoin needs the outcomes of the next macro events to be no worse than the assumptions already priced into rates, oil, and policy-probability markets.
Brent crude has moved above $100, the US 10-year Treasury yield was 4.80% on Sept. 8, and futures traders recently leaned toward another Federal Reserve rate hike. Yet Bitcoin remains above Glassnode’s $76,600 True Market Mean and just below a dense set of cost-basis and liquidation levels.
The decisive test is what inflation, the Fed, the Bank of Japan, or the Strait of Hormuz would have to deliver to change the market’s information set enough to push Bitcoin into a different regime.
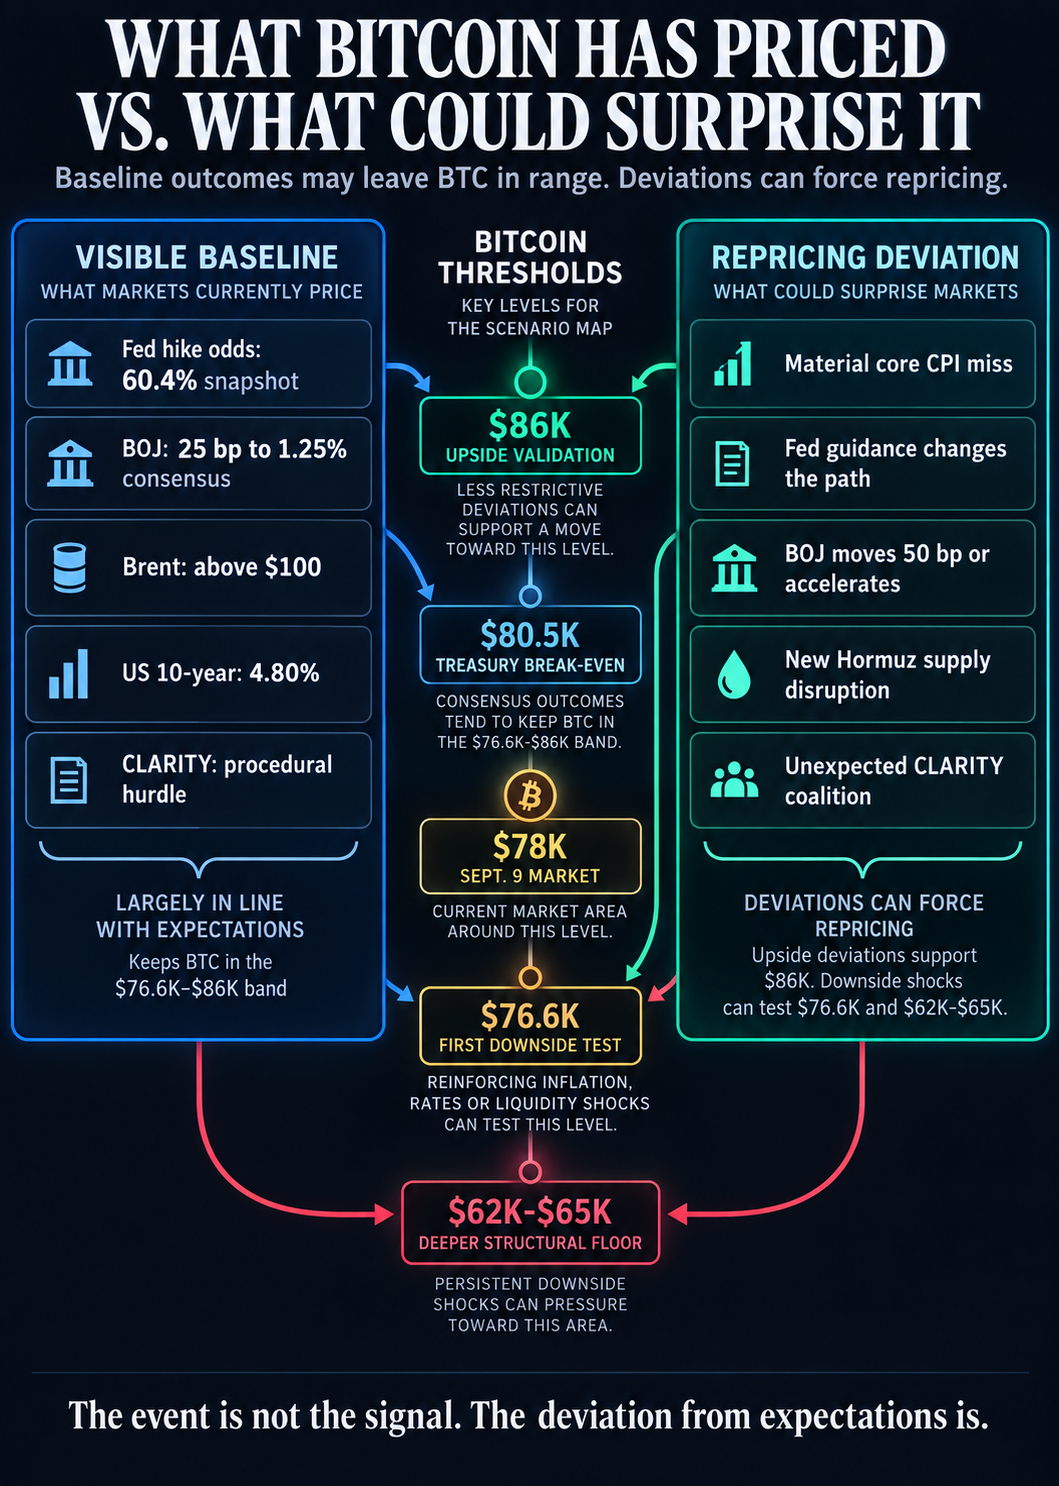
Bitcoin is already inside the decision zone
Glassnode’s Sept. 9 report identifies $83,000 to $86,000 as the overhead band where long-term-holder cost basis, modeled short-liquidation exposure and US spot exchange-traded fund break-even levels converge.
Over 1 million BTC was acquired in that range, and Glassnode also said the modeled short-liquidation shelf from $82,000 to $86,000 grew 21% after Aug. 19, while the ETF complex’s estimated break-even sat near $86,000.
Corporate treasuries break even around $80,500, creating an intermediate level just above the current market.
Below spot, the True Market Mean sits near $76,600. Glassnode’s deeper accumulation floor is $62,000 to $65,000, alongside modeled long-liquidation exposure around $60,000 to $63,000.
These thresholds help judge whether a macro outcome added genuinely new information.
A sustained move through $86,000 would indicate that Bitcoin absorbed a large block of overhead supply and pushed major institutional holdings back toward profit.
A loss of $76,600 would signal that the floor under the recent rally was weakening. The lower $62,000 to $65,000 band is the deeper structural failure point in Glassnode’s framework.
The market is also approaching the ceiling without the on-chain behavior normally associated with urgent distribution. Glassnode’s seven-day Sell-Side Risk Ratio fell from a 16-basis-point August peak to 7 basis points per day. Long-term holders’ share of realized profit fell from 88% to 47% over the same broad comparison.
That means the macro backdrop looks more alarmed than current holder spending.
The Bureau of Labor Statistics will publish August inflation data at 8:30 a.m. ET on Sept. 11. July headline CPI was 3.4% from a year earlier, while core inflation was 2.5%.
The US Treasury’s yield curve put the 10-year yield at 4.80% on Sept. 8. A modest inflation print would reduce the need for traders to price in an increasingly aggressive policy path.
A materially hot core reading could reinforce higher yields, strengthen the case for a September hike and make $76,600 the first Bitcoin level to test. Conversely, a cooler reading that pulls yields lower could help Bitcoin challenge the $80,500 corporate treasury break-even before the larger $83,000 to $86,000 supply band.
An in-line report can produce noise without changing the underlying regime.
The Federal Reserve’s calendar confirms that officials meet Sept. 15 and 16, with the decision and press conference on Sept. 16.
After the August jobs report, the CME FedWatch put the probability of a September hike at 60.4%, up from 57% one week earlier. By contrast, a Reuters poll conducted Sept. 4 to 9 found 65 of 93 economists expected the Fed to hold its 3.50% to 3.75% range.
The bigger shock would be a 25-basis-point hike paired with guidance implying a faster or longer tightening cycle. A hold, paired with limited appetite for future hikes, would pull in the opposite direction.
CPI will shape which of those outcomes the market regards as validation and which it regards as a break from the baseline. For Bitcoin, the policy path and Treasury response are key.
The Bank of Japan meets Sept. 17 and 18, and reports said a conventional 25-basis-point increase to 1.25% was the consensus, and officials had little appetite for a 50-basis-point move.
The more disruptive outcomes would be a larger move or guidance pointing to a materially faster cycle, because either could accelerate yen appreciation and pressure yen-funded positions across global markets. Bitcoin would be exposed through liquidity and risk appetite.
Oil adds an inflation channel to the same setup, as Brent registered an intraday high above $100 on Sept. 9 and Strait of Hormuz flows recently fell below 2 million barrels a day.
For oil to force another broad repricing, conditions would likely need to worsen enough to push energy prices materially above the level markets have already absorbed.
A renewed step-change in lost flows, shipping or infrastructure would be new information, especially if it arrived alongside an upside CPI surprise or a hawkish central-bank signal.
The Senate’s Sept. 15 action on the CLARITY Act sits lower in this hierarchy. The official schedule describes it as cloture on the motion to proceed to H.R. 3633.
An unexpected coalition could alter the policy outlook, but monetary conditions remain the stronger immediate driver of this scenario map.
What each outcome would need to change
| Catalyst | Observable baseline | Repricing deviation | Bitcoin threshold to watch |
|---|---|---|---|
| CPI | Inflation remains the key input before the Fed meeting | A material core surprise in either direction | $80,500 and $83,000 above; $76,600 below |
| Federal Reserve | Recent futures pricing leaned toward a 25-basis-point hike, while most economists expected a hold | A hold with restrained guidance, or a hike with a materially faster path | $83,000 to $86,000 above; $76,600 below |
| Bank of Japan | A conventional 25-basis-point increase is the reported consensus | A larger move or guidance for faster tightening | $76,600 first if global liquidity tightens |
| Brent and Hormuz | Brent above $100 and severe disruption are already visible | Another step-change in flows, shipping or infrastructure | $76,600, then the $62,000 to $65,000 floor |
| CLARITY Act | A difficult procedural vote, not final passage | An unexpected coalition that changes the bill’s path | Secondary to the rates and liquidity complex |
In the less-restrictive path, inflation cools enough to reduce pressure on the Fed, the US central bank holds or limits the urgency of further tightening, the BOJ delivers only the conventional move, and Gulf conditions stabilize.
Bitcoin would still have to clear $80,500 before confronting the $83,000 to $86,000 wall. A sustained move above $86,000 would be the strongest evidence that the market had repriced toward easier conditions and absorbed the overhead supply.
In the consensus path, CPI lands near expectations, the Fed and BOJ broadly match the distribution traders anticipated, and oil remains elevated without a new supply shock. Several large headlines could then arrive without forcing a new Bitcoin regime.
The cleanest expression would be continued trade between the $76,600 True Market Mean and the $83,000 to $86,000 ceiling.
The downside path needs shocks that reinforce one another: hotter inflation, a hawkish Fed path, faster BOJ tightening, or a new oil disruption. That combination could lift yields, tighten global funding conditions, and weaken risk appetite at the same time.
Bitcoin’s first structural test would be $76,600, and losing that level would bring the $62,000 to $65,000 accumulation floor back into view.
Bitcoin’s resilience near $78,000 shows the market has absorbed only the baseline versions of several visible threats so far. The next regime change depends on whether the coming outcomes fit that baseline or break it.


